

Introduction
Computer vision has become a core technology for modern retail, helping stores monitor inventory, improve customer experiences, and reduce shrink in real time. However, measuring success requires more than tracking model accuracy.
Retail teams need operational metrics that connect AI performance to business outcomes such as stock availability, checkout efficiency, and labor productivity.
In this guide, you’ll understand which retail computer vision metrics matter most, how to interpret their benchmark values, and how to evaluate AI systems using practical formulas and production-ready frameworks.
Why Retail Needs Its Own Computer Vision Metrics
POS data tells you what sold. It never tells you what happened on the shelf before the sale or why a shopper walked away empty-handed.
Computer vision closes that gap. Cameras watch shelves, aisles, and checkout lanes in real time. But raw model scores like mAP or IoU don’t mean much to a store operations team. They need numbers tied to dollars, staffing, and shrink.
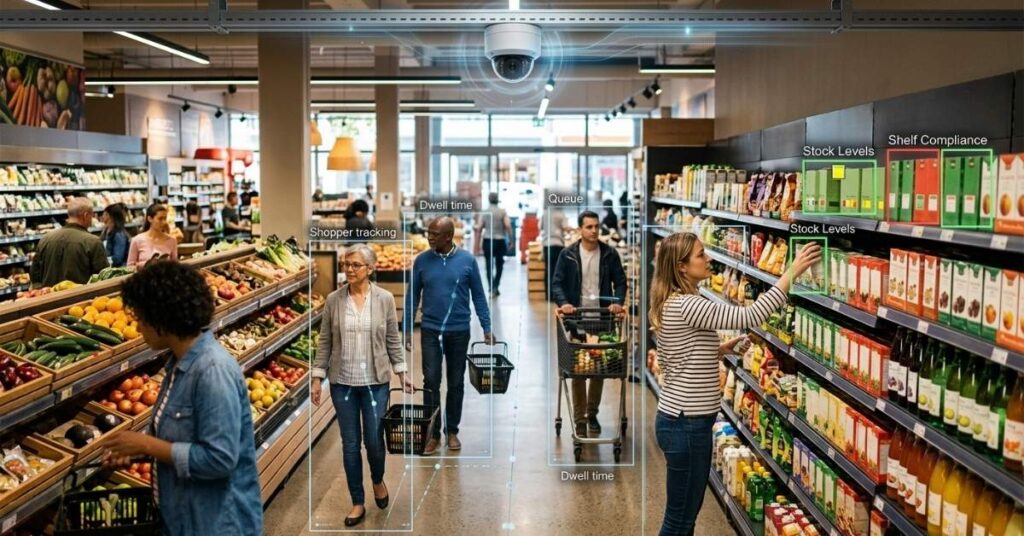
This guide separates the two layers clearly:
- Model performance metrics: how well the AI sees (mAP@50, IoU, recall)
- Operational metrics: how well the AI helps the business (OOS accuracy, shrink reduction, dwell time precision)
Retail engineering teams check both before they scale a pilot past a handful of stores. Skip either one, and you either ship an inaccurate model or a technically great model nobody in operations trusts.
Throughout this guide, benchmark values and evaluation examples are based on commonly used computer vision metrics, published industry practices, and production deployment patterns. Any proprietary frameworks presented here are intended as engineering evaluation methods rather than formal industry standards.
The typical data flow looks like this:
IP Camera Feed → Edge Frame Extractor → Object Detection Model (YOLOv8) → Logic Engine → Store Associate Alert
Every metric in this guide maps to one stage in that pipeline.
Common Evaluation Formulas Used in Retail Computer Vision
Before comparing operational benchmarks, retail teams typically evaluate core computer vision performance using the following standard metrics.
Precision
Precision measures how many detected objects are actually correct. High precision means the model produces fewer false alarms, making it especially important for self-checkout monitoring and loss prevention systems.
Formula:
Precision = TP ÷ (TP + FP)
Recall
Recall measures how many actual objects the model successfully detects. In retail, high recall helps reduce missed products, missed stockouts, and undetected checkout events.
Formula:
Recall = TP ÷ (TP + FN)
F1 Score
The F1 Score combines Precision and Recall into a single metric, making it useful when both false positives and false negatives affect business performance.
Formula:
F1 = 2 × (Precision × Recall) ÷ (Precision + Recall)
Intersection over Union (IoU)
IoU evaluates how closely the predicted bounding box overlaps the actual object location. Higher IoU values generally indicate more accurate object localization.
Formula:
IoU = Area of Overlap ÷ Area of Union
Mean Average Precision (mAP)
Mean Average Precision summarizes detection performance across all object categories and IoU thresholds. It remains one of the most widely used benchmark metrics for evaluating retail object detection models.
Unlike Precision or Recall, Mean Average Precision is calculated by averaging precision values across different recall levels and object classes. Most retail computer vision benchmarks report mAP at a fixed IoU threshold, such as mAP@50, or across multiple thresholds, such as mAP@50:95, to evaluate overall detection performance.
Core Metrics for Visual Inventory & Shelf Management
Shelf monitoring is the most common computer vision use case in retail. It’s also the hardest to get right, because shelves are cluttered, products look alike, and lighting changes hour to hour.
These foundational metrics provide the technical baseline for evaluating retail AI systems before measuring operational performance in real-world store environments.
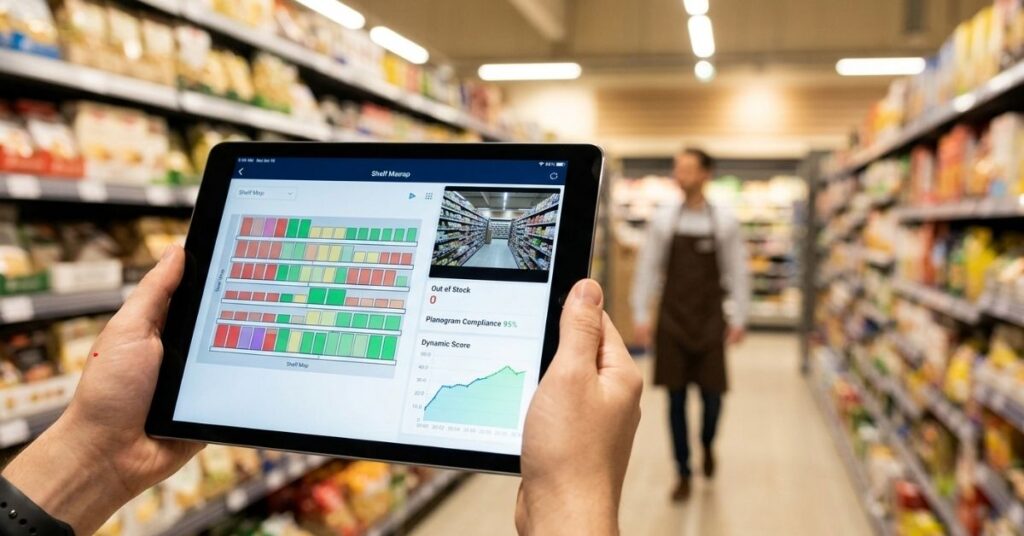
Out-of-Stock (OOS) Detection Accuracy vs. Visual Verification Latency
OOS detection accuracy measures how often the model correctly flags an empty shelf slot. Verification latency measures how fast that flag reaches a store associate.
A model can hit 95% accuracy and still fail the business if the alert arrives two hours late. Both numbers matter together, not separately.
Planogram Compliance Index (PCI) and Facings Accuracy
Planogram Compliance Index scores how closely the actual shelf matches the planned layout. Facings accuracy checks whether the system counts the right number of product units per SKU.
A low facings accuracy score usually means one thing: the model can’t tell two nearly identical products apart. That’s a training data problem, not a camera problem.
OCR Shelf Tag & Price Linkage Precision
Optical Character Recognition reads the price tag. Linkage precision checks whether that price tag actually connects to the right product in the system.
A mismatched tag creates a pricing error at checkout. That’s a compliance risk, not just an inventory nuisance.
Proprietary Methodology: The Dynamic Shelf Accuracy Matrix (DSAM)
Standard bounding box detection breaks down on crowded grocery shelves. A model can draw a perfect box around a product and still miss a blank price tag behind it, or confuse a duplicate SKU stacked two rows deep.
The Dynamic Shelf Accuracy Matrix fixes this by combining three signals into one score:
DSAM Score = w₁(mAP for facings) + w₂(Recall for tag linkage) − w₃(Occlusion Error Rate)
Here’s what each weight controls:
- w₁ rewards correct facing counts
- w₂ rewards correct price tag linkage
- w₃ penalizes errors caused by products blocking each other
This formula catches failure modes that plain mAP@50 completely misses. A shelf can score high on object detection and still fail a real audit, because DSAM accounts for occlusion, the single biggest source of shelf-scan errors in dense grocery aisles.
DSAM is designed as a supplementary engineering metric rather than a replacement for standard detection metrics.
Retail teams can adjust its weighting factors using validation data based on shelf density, camera placement, product similarity, and business priorities such as inventory accuracy, pricing compliance, or shrink reduction.
Used alongside mAP and recall, it helps identify operational issues that traditional detection metrics often overlook.
Customer Journey & Traffic Analytics Metrics
Shelf data tells you about inventory. Traffic data tells you about people.
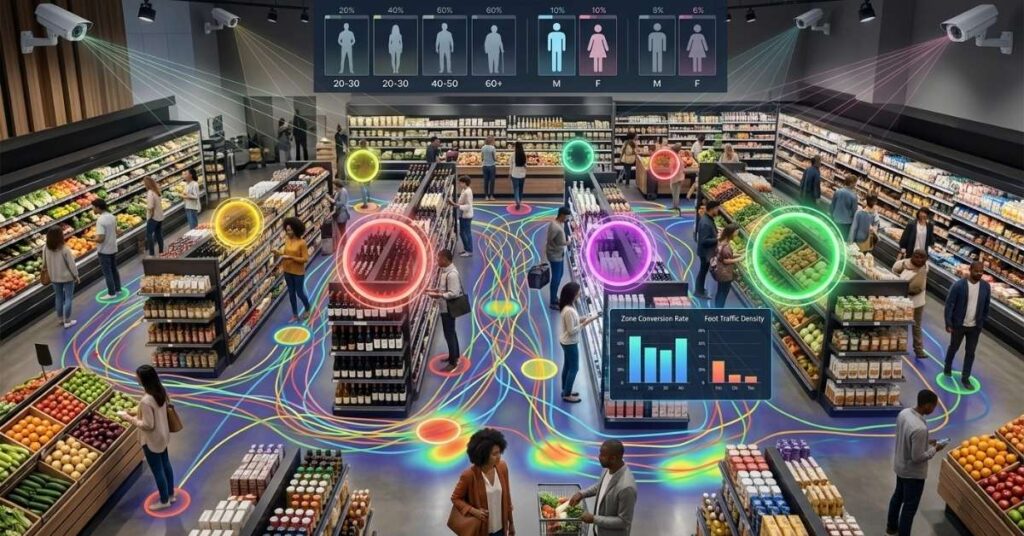
Dwell Time Precision and Pathing Fidelity
Dwell time measures how long a shopper stands in a zone. Pathing fidelity measures how accurately the system reconstructs the actual route a shopper walked.
Poor camera coverage creates pathing gaps. The system loses the shopper for a few seconds, then reconnects them somewhere else. That gap quietly inflates or deflates dwell time numbers if nobody checks for it.
Zone Conversion Rate vs. Foot Traffic Density
Zone conversion rate compares people who stopped in an aisle against people who bought something from it. Foot traffic density just counts bodies.
High traffic with low conversion usually points to a merchandising problem, not a marketing one. This metric pair catches that distinction fast.
Anonymized Demographic & Engagement Measurement Tolerances
Retail cameras estimate broad demographic categories for aggregate reporting only, never for individual identification. Every serious deployment sets a tolerance band for this estimation and documents the error margin openly.
Loss Prevention & Frictionless Checkout Metrics
Checkout is where computer vision earns or loses executive trust fast, because false alerts directly affect staff and customers.
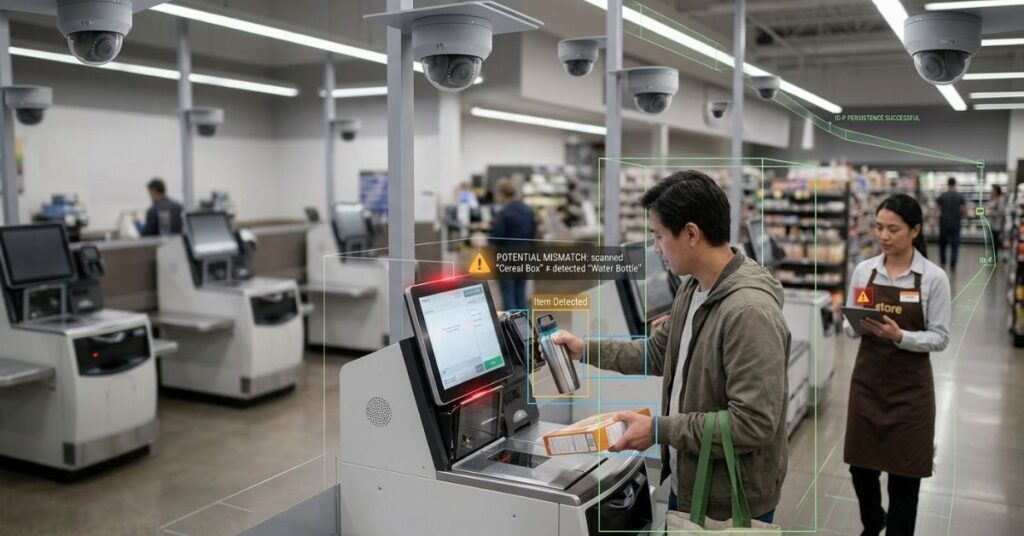
Self-Checkout Mismatch Detection & False Positive Rate (FPR)
Mismatch detection flags when a scanned item doesn’t match what the camera sees in the shopper’s hand. False Positive Rate tracks how often that flag is wrong.
A high FPR doesn’t just annoy customers. It burns out cashiers who have to intervene on every false alarm.
Multi-Camera ID Persistence Across Blind Spots
Stores rarely cover every inch with camera overlap. When a shopper crosses a blind spot, the system needs to keep tracking them as the same person on the other side.
ID persistence measures how often that handoff succeeds. A weak handoff creates duplicate shopper counts and broken basket-to-checkout matches.
Interaction Localization Precision (Item Pick vs. Item Return)
The camera has to tell the difference between a shopper picking up an item and putting it back. Get this wrong, and shrink reports fill up with phantom theft events that never happened.
Illustrative Self-Checkout Evaluation Scenario
The following example illustrates a realistic performance trade-off commonly observed during large-scale self-checkout evaluations. Actual thresholds vary by retailer, store layout, camera coverage, and model configuration.
Lowering the anomaly detection threshold can detect more theft attempts, but it often increases false cashier alerts.
Many retail deployments aim to keep the False Positive Rate below approximately 2–3% while maintaining high scan-mismatch recall, although acceptable thresholds vary by operational requirements and risk tolerance.
Recommended: Computer Vision Loss Prevention: AI Retail Shrink Reduction Guide
Technical Infrastructure & Edge Performance Benchmarks
In the absence of real-time hardware, none of the metrics above are meaningful.
On-Premise Edge Latency (Frame Processing Speed)
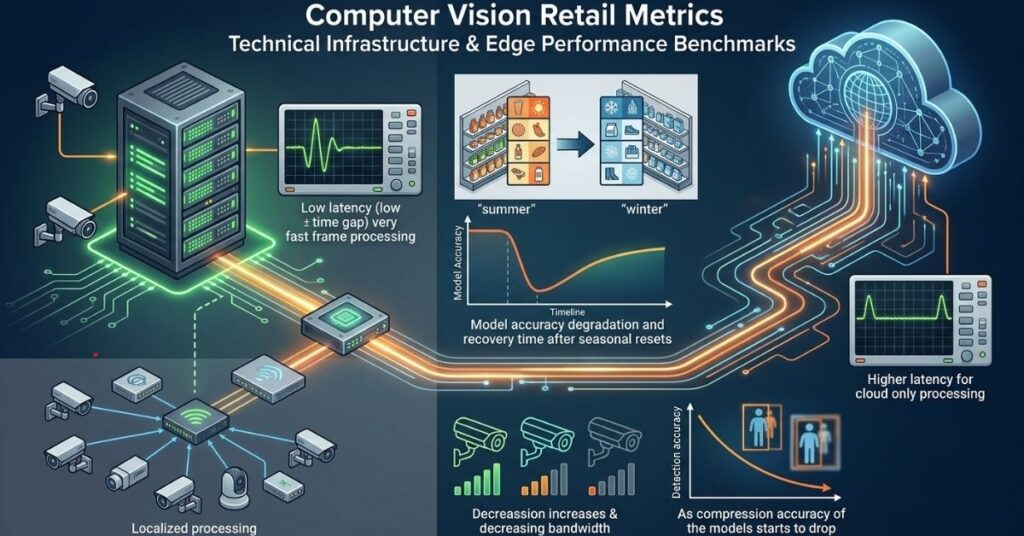
Latency measures how many milliseconds pass between a camera frame capturing an event and the system acting on it. Cloud-only setups add network round-trip time on top of inference time. Edge processing cuts that delay dramatically.
Model Accuracy Degradation During Seasonal Resets
Stores rearrange shelves for every seasonal reset. Every rearrangement confuses a model trained on the old layout.
Drift rate tracks how much accuracy drops after a reset, and how many days the model needs to recover through retraining or fine-tuning.
Video Stream Bandwidth & Compression Thresholds
More cameras mean more bandwidth. Compression settings trade video quality for network load, and pushing compression too far starts hurting detection accuracy directly.
Illustrative Comparison: Edge vs. Cloud Computer Vision Architectures
The following comparison illustrates the typical trade-offs between cloud, edge gateway, and smart camera deployments. Actual performance varies depending on hardware, network conditions, model optimization, and store environment.
| Architecture | Inference Latency (ms) | Shelf-Scan Accuracy (mAP@50) | Bandwidth / Camera / Day | Avg. Annual Downtime |
| Pure Cloud | 450–1,200 ms | 98% | 45 GB | 14.2 hours |
| Edge Gateway | 30–65 ms | 97–98% | 1.2 GB | 1.8 hours |
| Smart Camera (On-Chip) | 8–15 ms | 93% | 0.1 GB | 0.4 hours |
These values are illustrative and may vary depending on deployment conditions.
Privacy, Ethics, and Data Governance Metrics
Computer vision in retail runs directly into privacy law, so governance metrics matter as much as accuracy metrics.
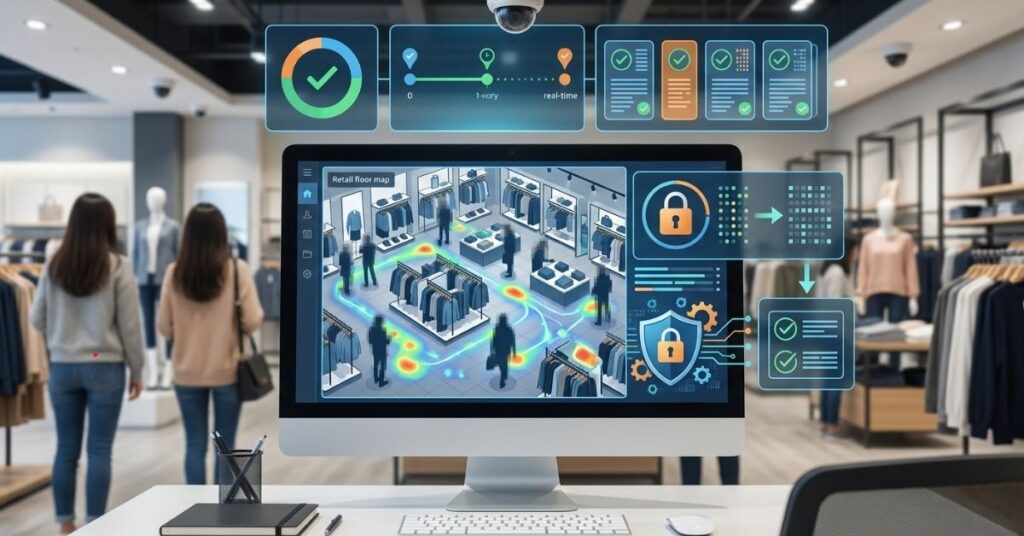
GDPR/CCPA Anonymization Audit Metrics
These audits confirm that no footage ties back to an identifiable individual without consent. Teams track the percentage of footage passing automated anonymization checks before human review.
Data Scrubbing Verification Latency
This measures how fast raw footage gets anonymized or deleted after processing. Regulators increasingly expect this to happen in near real time, not in an overnight batch job.
Many organizations also maintain audit logs documenting when footage was anonymized, who accessed it, and how long it was retained. These records simplify compliance reviews and demonstrate responsible AI governance.
Operational Evaluation Checklist for Retail AI Teams
Before scaling any computer vision pilot past a test store, run through this list:
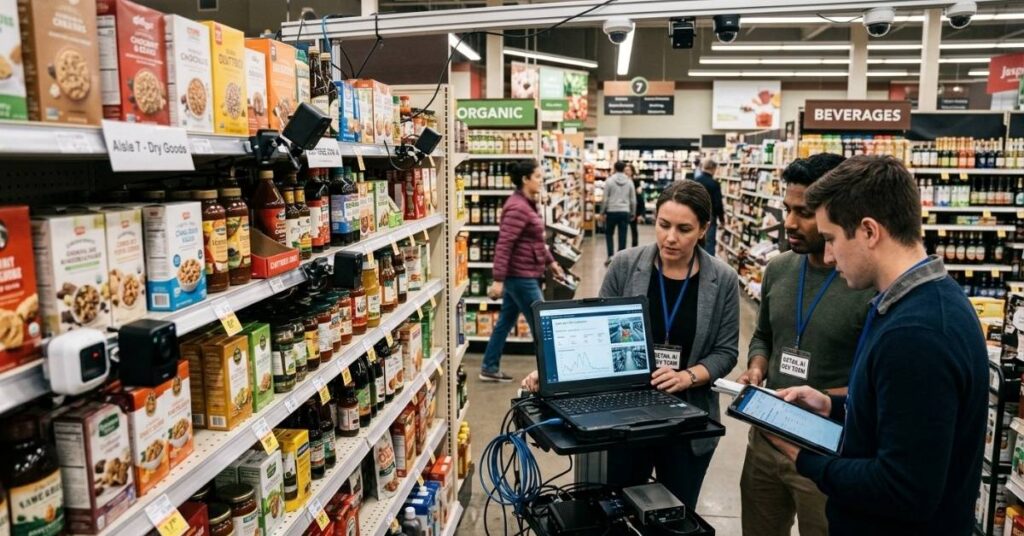
- Confirm mAP@50 and IoU scores on your own store’s camera angles, not vendor demo footage
- Test DSAM score across your densest, most cluttered shelf sections
- Verify OOS alert latency end-to-end, not just model inference time
- Confirm the checkout False Positive Rate remains below your defined operating threshold
- Confirm ID persistence across every known camera blind spot
- Measure drift rate after your next planned seasonal reset
- Audit anonymization compliance before go-live, not after
Completing these validation steps before deployment helps reduce operational risk, improves stakeholder confidence, and minimizes costly model retraining after rollout.
Frequently Asked Questions
What is mAP@50 in retail computer vision?
Mean Average Precision at a 50% IoU threshold. It measures how accurately a model detects and classifies products in an image.
What’s a good False Positive Rate for self-checkout systems?
Most retail deployments aim to keep the False Positive Rate below approximately 2–3%, although the ideal threshold depends on store operations, staffing levels, and risk tolerance.
Why does shelf-scan accuracy drop after a seasonal reset?
The model was trained on the old shelf layout. New product placement confuses it until retraining catches up.
How is Edge processing different from Cloud processing?
Edge processing runs the AI model on-site, near the camera. Cloud processing sends video to remote servers. Edge cuts latency and bandwidth use significantly.
Does in-store computer vision track individual shoppers by identity?
No. Compliant systems anonymize footage and report only aggregate, non-identifiable analytics.
What causes most shelf-scan errors in grocery stores?
Occlusion: products blocking other products from camera view. This is the exact gap the DSAM formula was built to catch.
Which computer vision metric is most important for retail inventory management?
No single metric tells the whole story. Most retail teams combine mAP, Out-of-Stock detection accuracy, alert latency, and planogram compliance to evaluate both model performance and real business impact.
Conclusion
Computer vision in retail lives or dies on the right metrics, not the flashiest model. A high mAP score means nothing if OOS alerts arrive too late, or if checkout false positives burn out your staff.
Successful retail AI programs continuously monitor these metrics after deployment to maintain accuracy, improve operations, and adapt to changing store conditions.
Start with the checklist in Section 7, benchmark your own stores against the numbers in this guide, and use these computer vision retail metrics to scale only once your real-world data, not a vendor’s demo reel, backs up the results.
References
Related AI Articles: Gcore AI Image Generator Review: Hands-On Testing, Speed & Real Results

Qasim Ali is a Lead AI Solutions Architect and the founder of TechyPulse, with over 12 years of experience in enterprise digital transformation. Holding an MSc in Computer Science, he specializes in making Artificial Intelligence, Cybersecurity, and Machine Learning accessible and scalable. Qasim is dedicated to decoding complex neural networks into actionable insights for the modern technical landscape.